The National Picture
The national four-year graduation rate reached 87% in 2022-23, but significant gaps persist. Understanding how rates are calculated helps schools identify where students fall through the cracks.
The Adjusted Cohort Graduation Rate (ACGR)
Federal accountability uses the Adjusted Cohort Graduation Rate: students entering 9th grade form a cohort, adjustments made for transfers in/out, and graduation within 4 years is measured.
The formula: Graduates ÷ (Cohort − Transfers Out + Transfers In) = Graduation Rate
Extended-Year Rates
Many students graduate in 5 or 6 years. Extended rates capture these graduates. While 4-year rate is primary for accountability, extended rates show full picture.
Graduation Tracking
Monitor credit completion, Michigan Merit requirements, and on-track graduation status.
Subgroup Rates
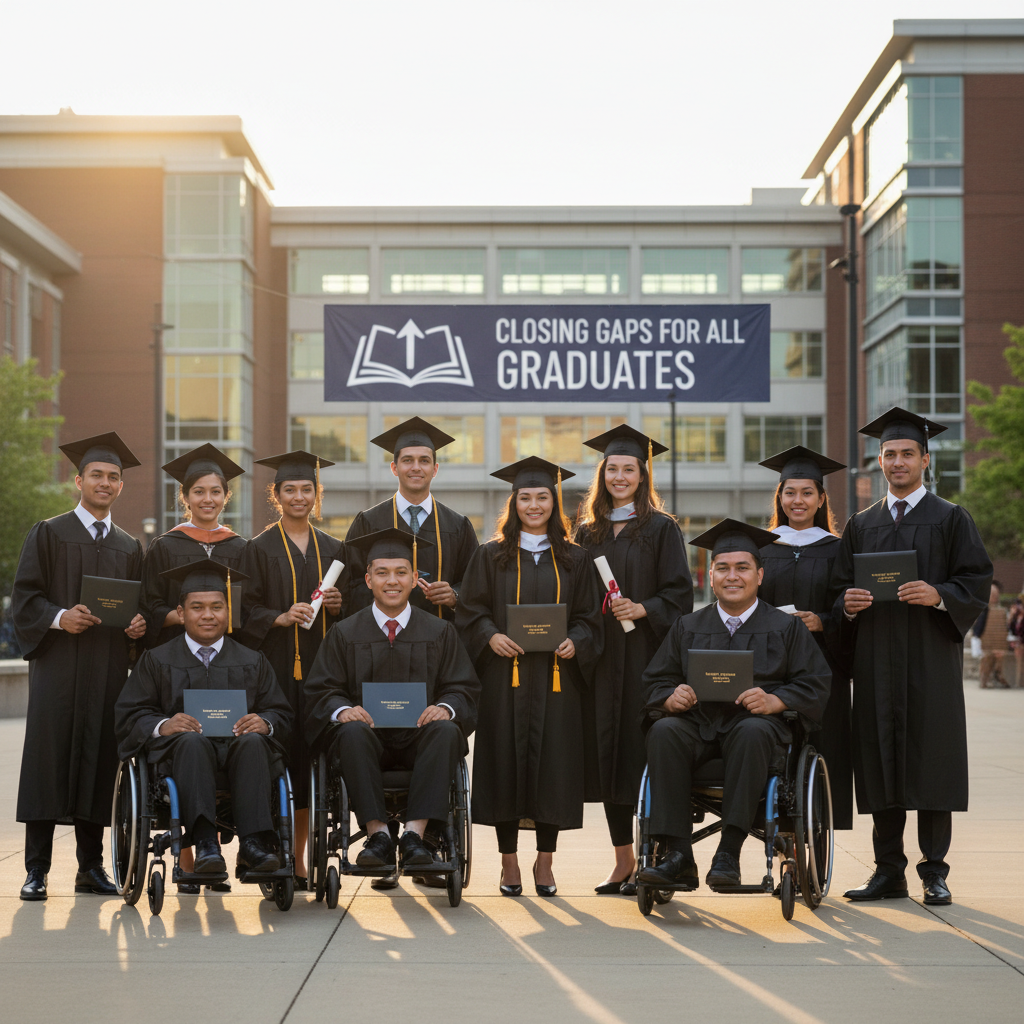
Disaggregated rates reveal disparities: race/ethnicity gaps, income gaps, special education gaps, and English learner gaps. Aggregate rates can mask significant subgroup differences.
What Rates Don't Show
- • College and career readiness
- • Quality of diploma earned
- • What happens after graduation
- • Student experience along the way
See AcumenEd in Action
Request a personalized demo and see how AcumenEd can transform your school's data.
Key Takeaways
- ACGR tracks a cohort from 9th grade, adjusted for transfers, measuring 4-year graduation.
- Extended rates (5-year, 6-year) capture students who need more time.
- Disaggregated rates reveal gaps masked by aggregate numbers.
Marcus Johnson
Director of Data Science
Data scientist specializing in educational analytics with expertise in growth modeling and predictive analytics for student outcomes.